Efficient diversification
Table of Contents
A. Trade-off between risk and return: Two assets
Q. What is efficient frontier?
- A curve that is formed by all possible weighted portfolios that can be constructed with the given assets.
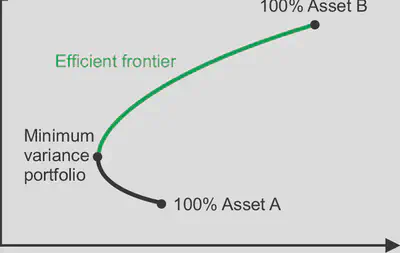
Minimum variance portfolio is the portfolio with the minimum variance and maximum returne.
- Portfolios on the upper part of the curve are preferred to the portfolios on the lower part of the curve.
- Why? Lower part has high risk but relatively low return compared to the upper part.
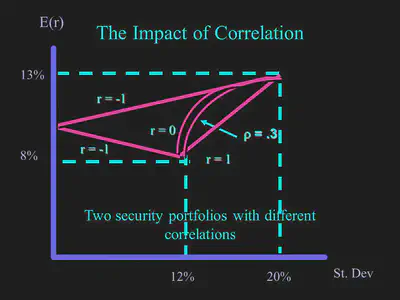
A portfolio is diversified if the correlation coefficient between the assets is less than 1.
$$\rho_{1,2,…,n} \lt 1$$
The positive effects of diversification INCREASE as the correlation between assets DECREASES.
I. Two-security portfolios with different correlations
B. Optimal Risky Portfolio
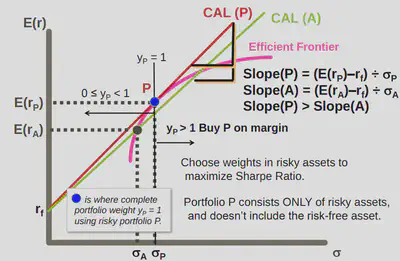
$$ \text{Sharpe Ratio}=\frac{E[r_p]-r_f}{\sigma_p} $$
What does it tell us?
- The premium (additional return) that is required to take a unit risk.
- Risk is quantified by standard deviation
Hence, the optimal risky portfolio has the HIGHEST sharpe ratio.
C. Efficient diversification with many risky assets
What is diversification?
-
Invest in a mix of different cateogires of financial assets to diversity the risk in your portfolio.
-
Choosing assets that are negatively correlated with each other and investing in a weighted manner on these assets such that the portfolio risk is minimized.
Why do you need it (How does it help)?
- Not all assets co-move at the same time due to different determining factors.
- As long as the correlation coefficient is not 1, you have diversified effect.
I. Variance of a portfolio with many stocks
$$ \sigma_p^2 = \Sigma_{I=1}^Q \Sigma_{J=1}^Q[W_IW_J \text{Cov}(r_I, r_J)] $$
$W_i$ is the percentage of each asset in the portfolio.
Facts
If i=j, then $\text{Cov}(r_i, r_j) = \sigma_I^2$
D. Efficient frontier
Efficient frontier is the set of portfolios that have the highest return for a GIVEN level of risk.
How do we create the efficient frontier?
-
Consider all possible combinations of securities, with all possible different weightings.
-
Keep the combinations that provide more return for less risk.
-
Portfolios along the efficient frontier are dominant = the best possible diversified combinations.
- Whats the error in the above video?
- The old man stands near the lower end of the efficient frontier
All investors should want a portfolio on the efficient frontier of ALL RISKY assets… until we add the riskless asset
- Why?
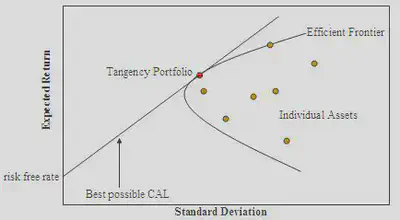
E. Combining the risk-free asset with the efficient frontier
A Complete portfolio is a portfolio that includes the risk-free asset and a risky portfolio. CAL.
Theorem: There is a single portfolio of risky assets that, when combined with the risk-free rate into a complete portfolio, dominates all other portfolios.
How this theorem derived? And what are the assumptions?
- In appendix
I. Potential Capital Allocation Lines
II. Capital Market Line
A special case of the CAL is the Capital Market Line (CML), where a portfolio P is the optimzal risky portfolio or tangency portfolio.
- The Capital Market Line (CML) is the dominant Capital Allocation Line (CAL) because it has the largest slope.
- Of all possible combinations of P & Rf, it has the highest Sharpe Ratio.
Why? Because combinations of P & Rf have an equal or higher Sharpe ratio than other portfolios on the efficient frontier.
F. Index Model & Capital Asset Pricing
An Index Model is a Statistical model of security returns.
I. Single Index Model
CAPM - Describes the relation between systematic risk and expected returns.
The single index model is an empirical model used to estimate systematic risk and test the CAPM.
Idiosyncratic risk is the risk that is unique to a particular security.
- Firm specific risk
- Diversifiable risk
- Unique risk
A Single Index Model (SIM) specifies two sources of uncertainty for a security’s return:
-
Systematic (macroeconomic) uncertainty (which is assumed to be well represented by a single index of stock returns)
-
Unique (microeconomic) uncertainty (which is represented by a security-specific random component)
A well-diversified portfolio has no idiosyncratic risk.
The remaining risk is called systematic risk / market risk. Systematic risk arises from events that affect the entire economy. These include changes in interest rates/GDP or financial crises.
II. Index Models
Ordinary least squares regression (Linear regression): $$Y = \alpha + \beta x + \epsilon$$
- $\beta$ is the senstivity of the dependent variable to the independent variable.
The same model can be applied to the relationship between the excess return of individual stock and the excess return of well diversified portfolio (eg. S&P 500).
$$R_{i,t} = \alpha_i + \beta_i R_{m,t} + \epsilon_{i,t}$$
-
$R_{i,t}$ is the excess (risk premium) return of the stock i at time t; ($r_{i,t}-r_{f,t}$).
-
$\beta_i$ is the sensitivity of the excess return of the stock to the excess return of the market.
-
$\epsilon$ is the unanticipated firm-based risk (abnormal return)
$\beta_i R_{m,t}$ is the systematic risk of the stock i.
To Remember
- $\epsilon_{i,t}$ Idiosyncratic component of return: Part of $R_{i,t}$ NOT explained by $R_{m,t}$.
- Each month, you have $\epsilon_{i,t}$
- $\alpha_i$ average excess return not explained by bi and the market risk premium.
- Only one value for the whole time periods of regression.